Sunday, November 15, 2009
Wednesday, September 9, 2009
Data Mining Tools: From SAS to R/Java
After a few months using SAS, I find it a powerful and interesting tool to use. It has its own programming language (SAS Base) which allows you to be very specific. On the other side, you have a strong GUI (Enterprise Guide) which lets you perform several tasks using drag and drop. One of the main issue with SAS is, of course, its price. Not every company can afford a SAS license.

The question then is: when you have SAS code, how can you convert it to a free programming language such as Java or R? After some search on the web, I found the following solutions:
- From SAS to Java: In the first look it seems difficult to compare SAS with Java code, since they are very different (Java is web oriented). However, it seems that DullesOpen has a tool, named Carolina, to convert SAS into Java code. You can test their tool online and I have contacted them to get a trial version. I will let you know when I have more information about this tool.
- From SAS to R: SAS system and R language (the free version of S programming language) are quite close since they are both statistics oriented. Of course, the syntax is completely different. Up to know, I didn’t found any tool for automatic SAS to R code conversion. I will comment this post as soon as I will find some interesting tool.
Ajay from DecisionStats told me about MineQuest. It seems that they have a tool to convert SAS code to WPS (World Programming System), a SAS Base clone. If you have some suggestions or way of converting SAS to any other language, you’re welcome to comment this post.
Thursday, August 20, 2009
Banking Data Warehousing
Despite widely reported disappointments, and some outright failures, of data warehouse initiatives, Gartner research shows that a data-warehouse-based architecture is the architecture of choice for customer information analysis and decision support among large U.S. retail banks. In a survey of U.S. retail banks with deposits of more than $1 billion, more than one-half of those with deposits of more than $4 billion said they use a data warehouse or data warehouse with associated data marts, with the percentage even higher for the very largest banks. In our research, the smaller banks (deposits between $1 billion and $4 billion) were more likely to say they use a series of unlinked data marts or rely on an operational customer information file (CIF) for analysis and decision support
What to install to use Data Mining
SQL Server 2005 comes with many components. This document describes what components are necessary to perform data mining once you have the SQL Server 2005 beta.
Analysis Services
Analysis Services is the only required component to install on the server. If you want to do data mining against existing SQL Server 2000 databases or other data sources (DB2, Oracle, Access, etc), this is the component you need to install.
Reporting Services
Install Reporting Services if you want to be able to create reports that work against your data mining models.
SQL Server Database Services
You only need to install the SQL Server relational engine if you want to use it as a data source, or if you want to use the Data Mining samples and tutorials.
Data Transformation Services
Installing DTS causes the DTS service to be installed on your server, allowing the running of scheduled packages. Install this if you want to use the integrated data mining tasks and transforms on your server.
Workstation Components, etc.
Install the Workstation Components, etc, on any client machine that will be creating mining models, authoring reports and DTS packages, or managing Analysis Services. The Workstation Components work equally well when installed on the same machine as the server.
Advanced
You will need to click the Advanced button to install the samples and sample databases. All the samples are located under Client Components/Documentation and Samples. The pertinent samples and databases to install are:
Databases:
AdventureWorksDW Sample Data Warehouse (requires you install SQL Server Database Services)
AdventureWorks Sample OLAP
Samples
Analysis Services Samples
Data Transformation Services Samples
Note that installing Samples installs the Samples installation packages. Links to run these are found under Start/Microsoft SQL Server 2005/Install Samples
Data Mining Dimensions
What is a data mining dimension?
A DM dimension is a dimension with a special parent-child hierarchy that's based on relationships discovered in your data by applying data mining, as opposed to a regular dimension where the hierarchies are user-defined. For example, you might discover interesting groups of customers by building a mining model that applies the Microsoft_Clustering algorithm on demographic data in your Customers dimension. A DM dimension based on this mining model can be used to browse your customer sales data and slice it by the customer groups found by the mining model.
How do I create and use a data mining dimension?
When you build a mining model based on an OLAP cube using the Data Mining Wizard in Business Intelligence Development Studio, the last dialog in the wizard allows you to create an associated data mining dimension as well a new cube that links to the measuregroups in the source cube and includes the DM dimension. When you browse the new cube, you can slice the data in the original cube using the new hierarchy discovered by the mining model.
You can also create a data mining dimension (and a cube that uses it) outside of the Data Mining wizard by selecting an existing OLAP mining model in the mining model editor and picking "Create a Data Mining Dimension" from either the Mining Model menu or the context (right-click) menu.
How does it work?
A data mining dimension is processed with a data source view that points to a DMX query which fetches data from an OLAP-specific view of the source mining model's content. You can run this query yourself to see what it returns:
SELECT * FROM
As part of the data mining dimension processing, a special index is built that maps cases in the mining model's source OLAP dimension to members in the data mining dimension (which represent a hierarchical view of nodes in the mining model content). This index is used when querying fact data using the data mining dimension.
The data mining dimension and its source mining model have to reside on the same Analysis Server database.
Which algorithms support data mining dimensions?
You can build data mining dimensions based on OLAP mining models that use the Microsoft_Decision_Trees, Microsoft_Clustering, Microsoft_Association_Rules or Microsoft_Sequence_Clustering algorithms. In addition, third-party plug-in algorithms may choose to support data mining dimensions.
Predicting future steps when you do not have enough history
No History? No Worries! Say you’re launching a new product and you want to predict what sales might look like in the next few months. Classical time series prediction does not work in this scenario because you don’t have historical sales data for the product. However, new SQL Server 2008 extensions to the Microsoft_Time_Series algorithm and DMX allow you to easily apply the patterns from another similarly-behaving time series to solve this conundrum.
Predicting Post-IPO Stock Values for VISA In this example, we illustrate how to use the PredictTimeSeries method with the parameter REPLACE_MODEL_CASES to obtain predictions for a time series for which we do not have enough historic data. The power of this combination comes into play when we have a time series with not enough historic data points to build a realistic model, but we know that this series follows a pattern similar to another time series for which we have enough historic data to build a model.
Here’s an Excel 2007 workbook that has 73 historic data points representing post-IPO daily closing values for the MasterCard stock and just 8 corresponding values for Visa (since we’re doing this 8 days after the Visa IPO). Our goal is to use the MasterCard stock history to derive better predictions for the Visa stock.
We will use the SQL Server 2008 Data Mining Client Add-in for Excel to build and query the time series model: 1. Make sure you have Excel 2007 with the DM Client add-in installed. 2. Save the workbook with the MasterCard/Visa stock data to your local disk and open in Excel 2007. 3. To create a model for the MasterCard stock data on the first worksheet, click on the “Data Mining” tab and select the “Forecast” task. 4. Select “Next” on the first page of the forecast wizard “Getting Started with the Forecast Wizard”. (Note: This page might not appear if you previously selected the option to skip the welcome page.) 5. On the second page “Select Data Source”, select the table we created previously and click on “Next” button. 6. On the “Forecasting” page, select the time stamp column to be the first column, named “TimeStamp”. 7. In the input columns grid, de-select the “TimeStamp” column and select the “MasterCard” column, then click “Next”. 8. On the last page of the wizard, rename the structure “MasterCardStructure” and the model “MasterCardModel”, leave the default selections to browse the model after it is created and to allow drill through, and click “Finish” to end the wizard and proceed to build the model. The MasterCard model historic data and the first 10 predicted values are illustrated in the following graph:
Now, use the same steps to create a time series model for the Visa stock using the 8 historical data points on the second workbook sheet. You will see right away that the model will not generate meaningful predictions due to the lack of sufficient historic data points. The VisaModel historic data and the next 10 predicted values are illustrated in the following graph:
Better Predictions Using REPLACE_MODEL_CASES A better approach is to use the knowledge that the Visa and MasterCard stocks have a similar pattern and to use the model built for MasterCard to obtain predictions for the Visa stock values. Here’s how (again using the Data Mining Client Add-in for Excel): 1. Select the “Query” task from the “Data Mining” ribbon and click "Next" on the introductory page. 2. Select the “MasterCardModel” model and click the “Advanced” button. 3. On the “Data Mining Advance Query Editor” page, click on the button “Edit Query”, select Yes on the dialog asking to confirm that “Any changes to the query text will not be preserved when you switch back to the design mode.” 4. Type the following query: SELECT (SELECT $Time, [MasterCard] as [Visa] FROM PredictTimeSeries([MasterCardModel].[MasterCard], 10, REPLACE_MODEL_CASES)) as Predictions From [MasterCardModel] NATURAL PREDICTION JOIN (SELECT 1 AS [TimeStamp], 64.35 as [MasterCard] UNION SELECT 2 AS [TimeStamp], 62.76 as [MasterCard] UNION SELECT 3 AS [TimeStamp], 64.48 as [MasterCard] UNION SELECT 4 AS [TimeStamp], 66.11 as [MasterCard] UNION SELECT 5 AS [TimeStamp], 69 as [MasterCard] UNION SELECT 6 AS [TimeStamp], 75.1 as [MasterCard] UNION SELECT 7 AS [TimeStamp], 82.75 as [MasterCard] UNION SELECT 8 AS [TimeStamp], 82.86 as [MasterCard]) as t
5. Click “Finish” and select the results of the query to be copied into a new worksheet. The results should look like this:
When the REPLACE_MODEL_CASES parameter is used, the PredictTimeSeries method will return the requested number of prediction obtained by replacing the last historic points of the given model with the new values provided in the query. In our case, the last 8 data points for the MasterCardModel are replaced with the values we generate on the fly using the SELECT and UNION options in the input set specified after the “NATURAL PREDICTION JOIN” keywords. Then, the MasterCardModel equations are used to predict the next 10 values for the Visa stock series.
To see the power of this method, we can compare the predictions obtained using the MasterCard model (Predictions.Visa), with the predictions generated by the VisaModel model obtained using only the limit sets of 8 data points of the Visa stock values (Predictions.Visa2). The results are illustrated in the following graph:
So there you go - you have a new tool in your arsenal when you don’t have enough data to make accurate time series predictions. Enjoy! |
| |


Wednesday, August 19, 2009
Quick Visualization of irs.gov Search Queries
Here is a quick visualization I did in honor of April 15th to investigate what people looking for on tax day…
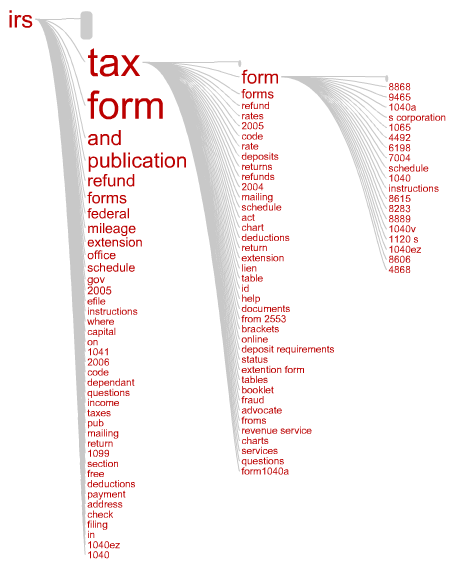
This “query tree” shows the most frequent searches starting with the term “irs”. Each branch in the tree represents a query where the words are sized according to frequency of occurrence. I like how you can see at a glance what the most popular tax forms are by following the “irs tax form …” branch. Apparently form 8868, Application for Extension of Time To File, is in high demand.
It was created by uploading search queries from AOL users leading to clicks on irs.gov during Spring 2006 to Concentrate, which generated the query tree. This image is a snapshot of an interactive flash visualization in Concentrate, where the focus term was “irs”. Looking at query patterns like this can help you get an idea of what people are looking for and how to better organize your site so they can find it quickly.
The interactive flash visualization was developed by Chris Gemignani using Flare with some input from Zach Gemignani and myself and inspiration from the Many Eyes WordTree.
The raw data is from the released AOL Search data sample, and consists of the subset of unique queries leading to clicks on irs.gov from March to May 2006. The IRS queries used to make the visualization can be downloaded here: irs.gov.queries.csv (191K)
Here are the top 10 queries in the file:
| Query | Searches |
| irs | 4787 |
| irs.gov | 2282 |
| www.irs.gov | 1975 |
| internal revenue service | 1154 |
| irs forms | 608 |
| tax forms | 361 |
| irs tax forms | 196 |
| internal revenue | 158 |
| taxes | 142 |
| wheres my refund | 139 |
| federal tax forms | 125 |
| irs refunds | 106 |